October 2023: Piston Prices Continue Rise as Jets and Turboprops Slow
As we’ve closed out October, the general and business aviation sectors traditionally experience a notable uptick in activity. This period marks a strategic window for transactions, with buyers looking to capitalize on end-of-year tax benefits and sellers aiming to close deals before the winter slowdown. Our market report will delve into the current trends as companies finalize their fiscal year budgets and individual buyers seek to secure aircraft ahead of the holiday season. Finally, let’s see what we can expect in the closing quarter of the year.
Beginning with an eye on the marco-trends, 2023 is already a banner year for aircraft sales, with nearly two months left to go. General and business aviation figures passed the five-year average sales volume during the summer season. Projects place total 2023 volume (inclusive of all registered non-commercial aircraft sold domestically) at 25-30% higher than the five-year average level and 50-60% above the figures for 2022. Piston numbers (single and twin combined) comprise the majority of this volume, with their share slightly above both last year’s and the five-year’s levels. This performance is particularly salient as we maintain a market with historic aircraft prices across the sector.
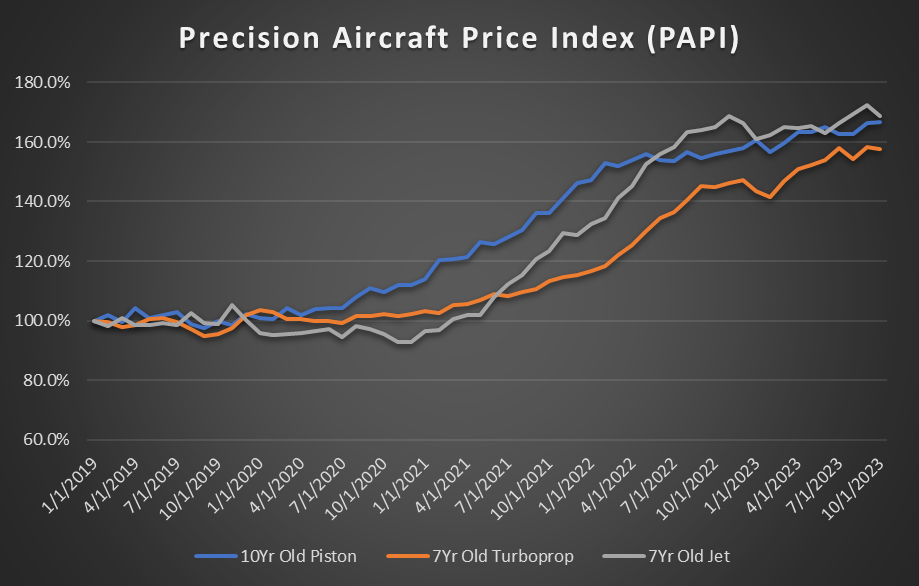
The trend of seller’s asking price remaining near all-time-highs continued through October, with piston prices climbing slightly as turboprops and jets relaxed modestly since the start of the month. Overall, we have a market condition with aggregate prices at +65% their January 2019 mark. Jets have maintained the highest relative appreciation among the three type categories since overtaking the pistons last summer, though that trend shows signs of inflection by the end of this month. Volume and demand metrics favor a strong showing from piston sales even with respect to end-of-the-year expectations in the jet market.
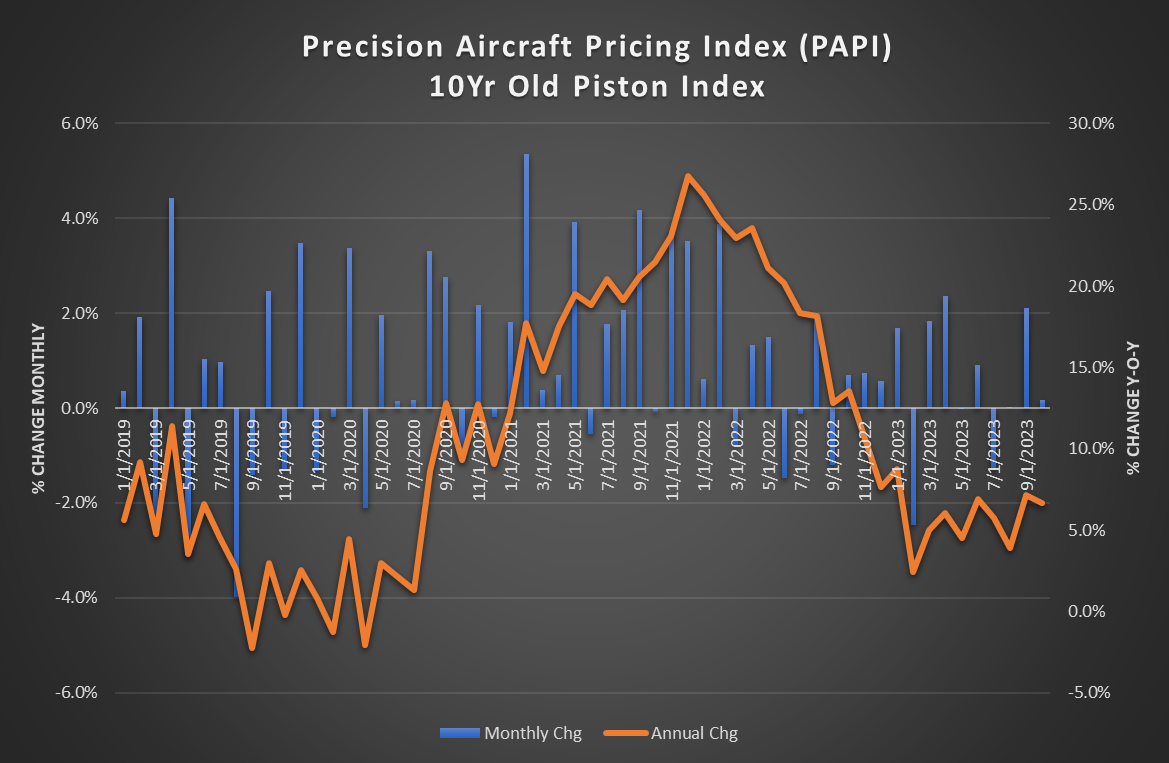
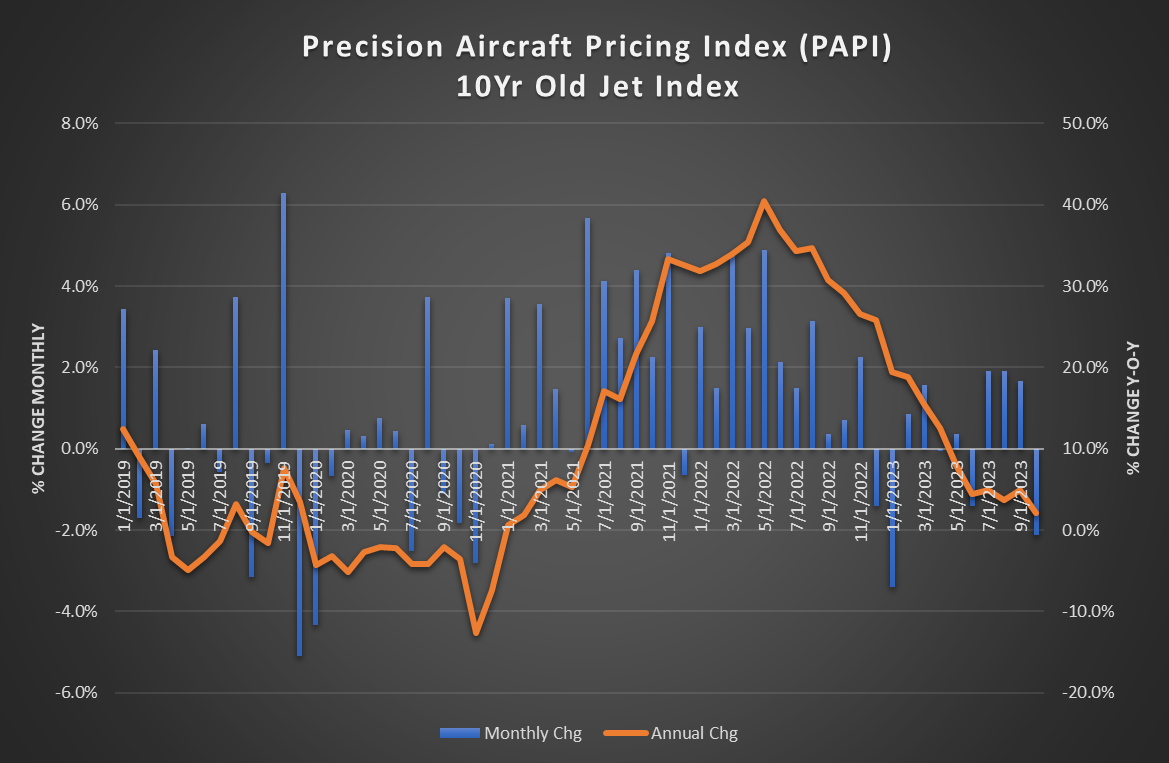
Examining piston and jet performance side-by-side, using a 10 year age as a benchmark, we can see some interesting trends over the last few years. The above plots show the change in PAPI value monthly as well as year-over-year (YOY), lending insight to how the market has changed since 2022 and how we got here. The piston chart provides a visualization of the lower monthly volatility (in terms of change in market price month-to-month) compared to the jet chart, as well as a consistent trend of monthly appreciation in market price compared to jets. The piston market also shows an annual PAPI trend that is strongly positive, compared to the jet market that spends more time in a period of deeper annual depreciation. Here again, the jet’s volatility at market can be seen in both the -10% YOY of winter 2020 as well as the +40% YOY of May 2022. Looking forward, we can see pistons in a period of relatively consistent YOY appreciation near the 5% mark as well as jets trending towards November ending as a month of light YOY depreciation.
With all of this in mind, we will maintain a keen eye on the jets and pistons in particular, seeing if the trends at present hold course for the slower winter months. Business acquisitions should hold both categories to relatively high volumes and support the historic price trend of 2023. Stay tuned for the November market report, where we will be able to take a closer look as to how the year will wrap up and what market conditions will set the stage for 2024. If you are thinking of transacting this time of year, check out our Pro Buyer Program or Pro Seller Program to see how data just like this can power your next aircraft endeavor.